
Estimating Your Total Injection Molding Project Budget
Breaking Down the Two Main Cost Components
Injection molding budgets consist of two distinct financial categories: Non-Recurring Engineering (NRE) and recurring unit costs. NRE covers one-time expenses like mold design and fabrication, while unit costs cover material and machine time per part.
- Small Runs: Tooling often represents 60-80% of the total initial spend.
- Large Runs: Unit production costs dominate, diluting the initial tooling investment over thousands of parts.
Do not overlook hidden logistical and post-processing expenses in your initial calculations. Shipping, custom packaging, and secondary operations like ultrasonic welding or painting can add 15-25% to the final bill.
Calculating Upfront Tooling Investment
Mold pricing varies significantly based on steel grade and complexity. Prototype molds using aluminum or soft steel typically cost $5,000–$15,000, whereas production-grade hardened steel molds range from $20,000 to $100,000+.
Larger parts require bigger mold bases, which increases material costs exponentially. Adding cavities multiplies output but also raises the initial investment by approximately 40-60% per additional cavity.
Determining Per-Unit Production Costs
Cycle time is the primary driver of manufacturing efficiency and labor allocation. A 30-second cycle allows for roughly 120 parts per hour, directly dictating the machine hourly rate allocated to each unit.
Material costs depend on the part’s shot weight plus a standard scrap allowance. Industry practice typically adds a 3-5% scrap rate to account for sprues, runners, and startup waste.
- Low Volume: Higher per-unit cost due to fixed setup fees.
- High Volume: Significant price drops as setup costs amortize over larger quantities.
Creating a Realistic Financial Forecast
Build a dynamic spreadsheet that separates fixed tooling costs from variable production expenses. This model should allow you to adjust volume scenarios to see how break-even points shift.
Always allocate a contingency budget of 10-15% for unforeseen engineering changes. Mold maintenance, minor design iterations, and unexpected rework are common realities in physical manufacturing.
Key Drivers Influencing Injection Molding Prices
Impact of Part Geometry and Complexity
Complex features like undercuts require side actions or sliding cores. These mechanisms increase mold build time and maintenance costs significantly.
- Wall Thickness: Uniform walls ensure consistent cooling. Variations cause sink marks and extend cycle times by 15-20%.
- Surface Finish: SPI-A1 polished finishes demand hours of manual labor. Textured surfaces (e.g., VDI 3400) are often cheaper to produce but require specific draft angles.
Material Selection and Its Cost Implications
Commodity plastics like PP and ABS cost significantly less than engineering resins. PEEK can cost 10-20 times more per kilogram than standard polypropylene.
Virgin materials offer consistent mechanical properties and color stability. Regrind reduces raw material costs but may degrade impact strength after multiple heat histories.
Mold Construction and Quality Standards
Aluminum molds suit low-volume prototypes due to faster machining. Hardened steel (H13, S7) is essential for high-volume production exceeding 100,000 cycles.
- Cavity Count: Multi-cavity molds lower unit price at high volumes. Single-cavity tools reduce initial capital expenditure and risk.
- Hot Runners: These systems eliminate sprue waste and reduce cycle time. However, they add $5,000-$15,000 to initial tooling costs and require complex temperature control.
Production Volume and Lead Time Constraints
Suppliers offer tiered pricing based on annual volume commitments. Higher volumes amortize fixed setup and tooling costs over more units.
Rush orders often incur premiums of 20-50% above standard rates. Expedited manufacturing requires overtime labor and prioritized machine scheduling.
- MOQ Impact: Low Minimum Order Quantities raise the average unit cost. Setup time remains constant regardless of batch size.
- Efficiency Gain: Running larger batches maximizes machine uptime. This reduces the per-part allocation of hourly machine rates.
Comparing Injection Molding to Alternative Manufacturing Methods
Injection Molding vs. 3D Printing (Additive Manufacturing)
Injection molding becomes cost-effective at higher volumes due to high initial tooling costs. The break-even point typically occurs between 500 and 1,000 units for standard geometries.
- Surface Finish: Injection molding offers smooth surfaces (Ra 0.4–1.6 µm) without post-processing. 3D printing often requires sanding to remove layer lines.
- Material Strength: Molded parts exhibit isotropic strength. FDM prints are weaker along the Z-axis due to layer adhesion issues.
Injection Molding vs. CNC Machining (Subtractive Manufacturing)
CNC machining is ideal for low-volume, high-precision parts where tooling costs are unjustified. It avoids the $5,000–$50,000 upfront investment required for injection molds.
However, CNC generates significant material waste, often exceeding 50% of the raw stock. Injection molding produces minimal waste, limited mostly to sprues and runners which can be reground.
- Geometric Complexity: CNC struggles with internal undercuts without multi-axis setups. Injection molding handles complex internal features easily via side-actions.
- Lead Time: CNC parts are ready in days. Injection molding requires 2–6 weeks for mold fabrication before production starts.
Injection Molding vs. Vacuum Forming and Urethane Casting
Vacuum forming is a viable alternative for large, thin-walled parts like packaging or trays. It uses lower-cost aluminum or composite molds compared to steel injection tools.
Urethane casting serves as an excellent bridge process for 20–100 units. It mimics injection molded properties using silicone molds but lacks the thermal stability for high-volume runs.
Making the Right Choice for Your Production Stage
Select the manufacturing method based on current volume needs and future scalability. A hybrid approach often yields the best results for product development cycles.
- Validation Phase: Use 3D printing for form and fit checks. This minimizes risk before cutting steel.
- Bridge Production: Utilize urethane casting for market testing. It allows functional testing with near-production materials.
Switching methods mid-project incurs significant redesign costs. Engineers must account for draft angles and wall thicknesses early if injection molding is the end goal. Ignoring these constraints during prototyping leads to expensive tooling revisions later.
Strategic Ways to Reduce Injection Molding Costs
Implementing Design for Manufacturability (DFM) Principles
Simplify part geometry by eliminating unnecessary undercuts. This reduces side-action requirements in the mold, lowering tooling complexity and cost.
- Maintain uniform wall thickness between 1.5mm and 3.0mm for most thermoplastics.
- Apply draft angles of 1° to 2° on vertical walls to ensure smooth ejection.
Consistent wall thickness prevents sink marks and warping during cooling. It also allows for faster cycle times by ensuring uniform heat dissipation.
Optimizing Mold Design for Efficiency
Select the cavity count based on annual volume projections rather than maximum capacity. Over-engineering cavities increases initial tooling costs without guaranteeing ROI.
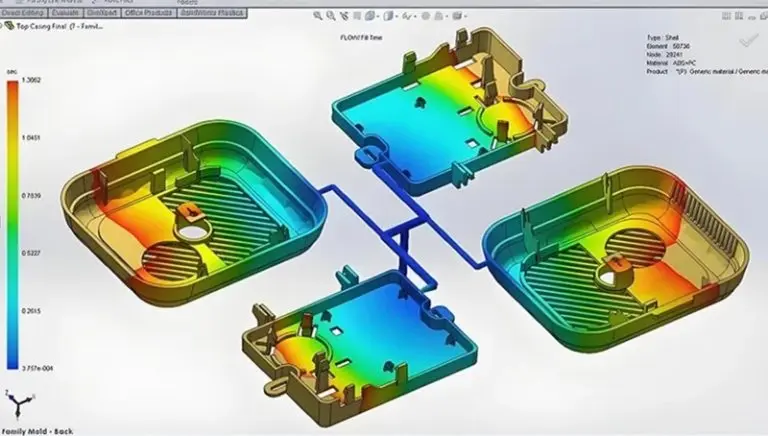
Consider family molds for low-volume assemblies requiring multiple unique parts. This approach shares a single tooling base, significantly reducing upfront investment.
Choose submarine or valve gates to minimize visible gate marks. This reduces or eliminates the need for manual degating and secondary finishing labor.
Smart Material and Supply Chain Choices
Source resins from local suppliers to cut shipping fees and avoid import tariffs. Local sourcing also shortens lead times, improving inventory turnover.
- Negotiate bulk pricing tiers for standard grades like PP or ABS.
- Verify supplier consistency with ISO 9001 certification to prevent batch variations.
Evaluate recycled resin blends for non-cosmetic internal components. Using 20-30% post-industrial recycled content can lower material costs by 10-15%.
Ensure recycled materials meet mechanical property requirements before full-scale adoption. Test tensile strength and impact resistance to avoid field failures.
Streamlining Post-Processing and Assembly
Design snap-fit features with appropriate retention angles to replace screws or adhesives. This eliminates fastener inventory and reduces assembly time per unit.
- Use integral colorants instead of post-mold painting for aesthetic parts.
- Match resin color codes directly to Pantone standards to ensure consistency.
Implement automated optical inspection (AOI) systems for high-volume runs. AOI detects flash or short shots faster than manual visual checks.
Automated quality control reduces labor overhead and minimizes human error. It ensures consistent defect tracking and data collection for process improvement.
Validating Supplier Quotes and Market Rates
Benchmarking Industry Standards for Tooling
Mold base costs vary significantly by region due to labor and overhead differences. Use the table below as a baseline for initial quote validation.
Be wary of quotes falling 30% below these averages. Such prices often indicate substandard steel grades or skipped heat treatment processes.
A “turnkey” quote must explicitly list all included services. Verify if it covers design, manufacturing, testing, and initial sample shipment.
- Design: DFM analysis and mold flow simulation.
- Production: Full cavity machining and assembly.
- Validation: T1 samples and dimensional reports.
Analyzing Unit Price Breakdowns
Request detailed cost sheets to isolate material, machine time, and labor costs. This transparency prevents suppliers from bundling inefficiencies into a single lump sum.
Compare hourly machine rates against supplier tier standards. Large facilities often offer lower rates due to economies of scale.
Scrutinize raw material markups carefully. A fair markup typically ranges from 5% to 15% over current market indices.
Identifying Hidden Fees and Ambiguities
Clarify mold ownership terms in writing before production begins. Ambiguity here can lead to unexpected storage fees or release holds.
- Ownership: Buyer retains title upon full payment.
- Storage: Free for 3-6 months; charged thereafter.
Trial runs and modifications often incur separate charges. Define limits for T1 and T2 sample costs in the contract.
Verify if packaging and freight are Incoterms-compliant. Ex-Works quotes exclude shipping, while DDP quotes include all logistics costs.
Negotiating Fair and Sustainable Pricing
Leverage competitive quotes to negotiate better payment terms or unit prices. Suppliers often match competitors to secure long-term volume.
Establish multi-year contracts to lock in favorable raw material rates. This strategy mitigates volatility in commodity markets.
- Volume Commitment: Guaranteed annual orders.
- Price Review: Semi-annual adjustments based on indices.
Build partnerships focused on continuous cost improvement. Collaborate on design changes that reduce cycle time or material waste.